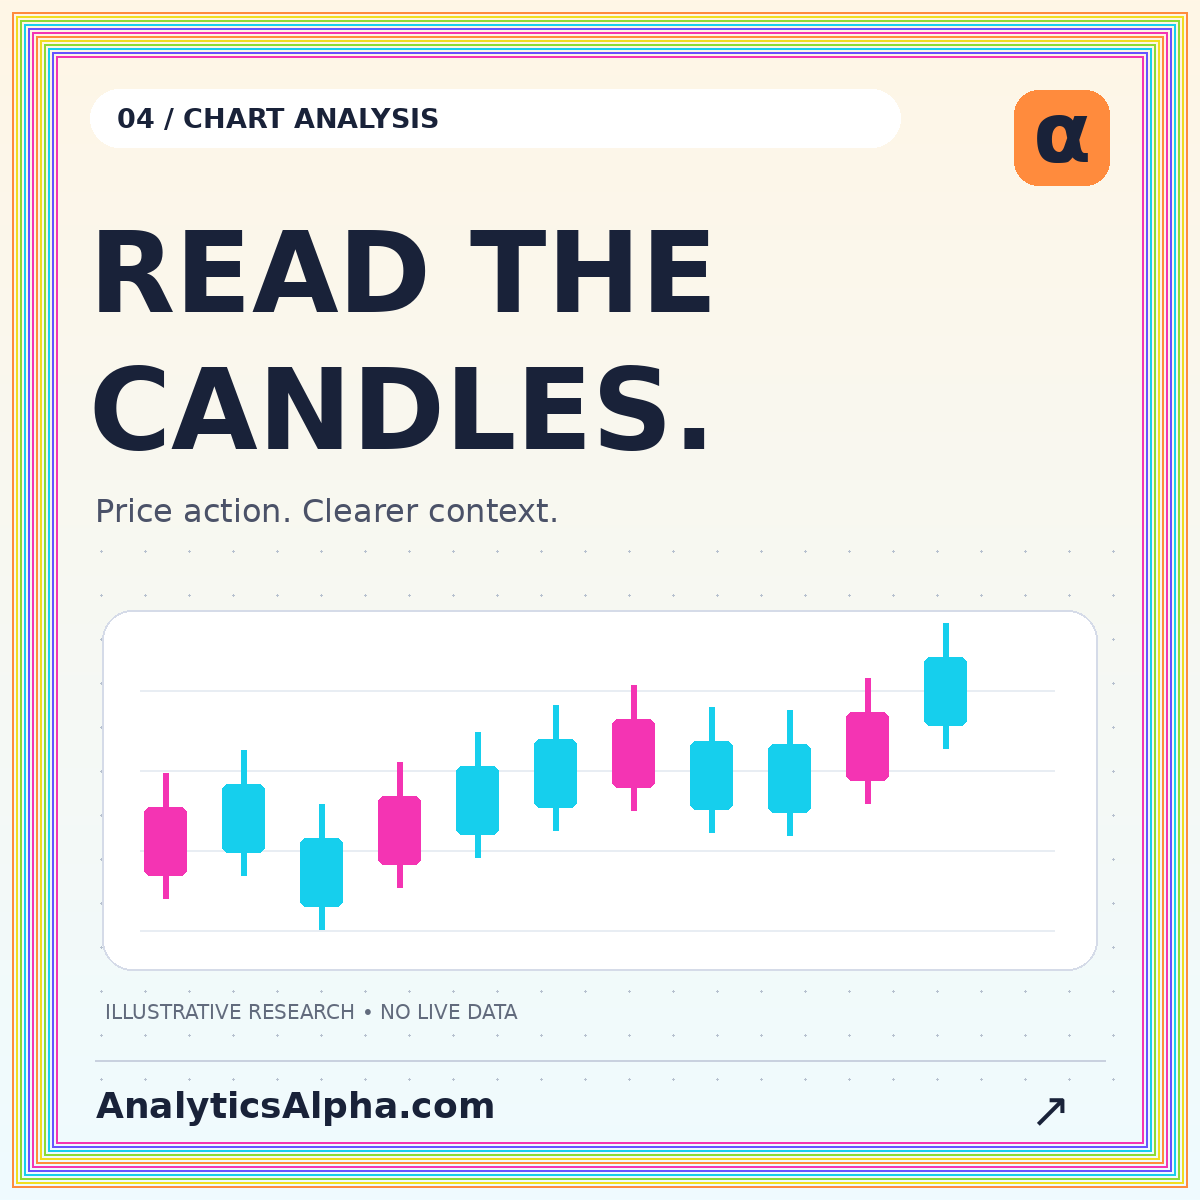
A candlestick chart turns four price observations into a compact visual record. Each candle shows an opening price, the highest and lowest prices recorded in the interval, and a closing price. Learning to read those observations is more useful than memorizing a long list of pattern names. A chart can describe what happened without revealing why it happened or what must happen next.
This guide builds a practical reading order: identify the data, understand the candle, inspect its surroundings, and then formulate a question. All numerical examples are hypothetical. The goal is a consistent chart-analysis process rather than a collection of automatic trading signals.
Know exactly what one candle represents
A daily candle summarizes one daily interval as defined by the data provider. A five-minute candle summarizes five minutes. The same instrument can therefore look very different at different chart resolutions without either view being wrong. Each compresses a different amount of information.
Before interpreting a shape, identify the symbol, venue, currency, time zone, and session definition. Establish whether extended-hours observations are included and whether the displayed candle is still forming. A candle observed halfway through its interval is not the same information as the completed candle used in a historical chart.
For a concrete data reference, QuantConnect's US-equity data documentation describes trade-bar fields including open, high, low, and close. Whatever platform you use, check its field definitions rather than assuming all charts use identical inputs.
Read the body and the wicks
The candle's body spans the opening and closing prices. Its wicks extend toward the high and low. If an invented interval opens at $50, reaches $53, falls to $49, and closes at $52, the body spans $50 to $52, the upper wick reaches $53, and the lower wick reaches $49.
Many chart styles use one color for a close above the open and another for a close below it. Some use hollow and filled bodies or compare the close with the previous close. Check the legend. Color conventions are not universal, and a green candle does not necessarily mean the price finished above the previous session's close.
For example, a session can gap down from $55, open at $50, and close at $52. It rises during that session but remains below the previous close. The intraperiod body and the between-period change tell different stories.
Measure proportions before naming patterns
In the example above, the total range is $4 and the body is $2. The body occupies half the range. The upper and lower wicks each occupy one quarter. These measurements provide a reproducible description that does not depend on whether someone calls the candle “strong,” “hesitant,” or something else.
A small body simply means the open and close were near one another relative to the chosen scale. It does not mean little activity occurred inside the interval. Long wicks indicate that the recorded extremes were farther from the body; they do not identify the participants or prove their intentions.
When using a named pattern, define its tolerances. How small must a body be? How long must a wick be relative to the range? Without definitions, two people can label the same chart differently while believing they tested the same idea.
Put each candle in context
A tall candle after a quiet sequence means something different descriptively from a similar candle during an already volatile sequence. Compare the range with a stated recent window rather than with whichever nearby candle is visually convenient. Note whether a gap, scheduled event, or a change in liquidity may have affected the interval.
Read the surrounding structure before adding indicators. Are recent highs and lows rising, falling, or overlapping? Is price near a previously identified zone? Define those zones using information available before the current candle. Drawing them after a move is complete can make historical charts seem easier to interpret than they were in real time.
The chart analysis workspace offers a sample-data view for comparing price and volume. Its purpose is to demonstrate the reading process, not to deliver live prices or recommendations.
Volume adds a different observation
Volume reports activity according to the data source's scope. It may represent one venue or a consolidated set of transactions. A volume bar should therefore be interpreted with the instrument and feed in mind. Do not directly compare counts that describe different trading populations.
In an illustrative review, a wide-range price bar with elevated volume can be recorded as a joint observation. That does not establish that the move will continue. Ask instead whether similar predefined observations had different outcomes in a properly constructed sample, after costs and without selectively omitting failures.
Comparisons within a session also need care. An opening interval and a midday interval may have different typical activity patterns. A useful relative-volume measure states its comparison window rather than dividing by an arbitrary average.
Separate observation from hypothesis
“Price closed above the previous twenty completed bars' highest high” is a testable observation. “Buyers are about to take control” is an interpretation that the chart alone does not establish. Separating the two makes chart notes clearer and reduces the temptation to rewrite a story after the outcome.
A hypothesis might ask whether a defined close above that level is followed by a particular distribution of returns over the next five bars. To test it, specify entry timing, exit timing, transaction costs, and how overlapping events are handled. A collection of attractive screenshots is not a substitute for the full event set.
The backtesting guide explains how timing assumptions can create false advantages. In particular, a rule that depends on a completed candle generally cannot assume an earlier execution within that candle using information not yet available.
Watch the axes and adjustments
A chart's vertical scale changes how dramatic a move looks. A tightly cropped price axis can make a small percentage change appear enormous. Compare percentage movements and record the displayed interval instead of relying only on the slope of the line or the height of the candle.
Corporate actions can also affect the series. A split changes share units and prices; a dividend affects the relationship between a price series and a total-return series. Know whether historical observations have been adjusted and whether the same convention is used throughout the analysis.
For charts that span instruments with very different nominal prices, percentage changes may be more useful than dollar ranges. The method should match the comparison, and the chart should disclose the units.
Build a repeatable chart note
A compact note can contain the instrument and session, the observation time, the completed-bar interval, the observed price structure, and the relevant volume comparison. Follow that with a separate hypothesis and the condition that would contradict it. Leave a space for the later outcome without overwriting the original note.
For example: “Sample instrument; fifteen-minute completed bars; price closed above the prior range; volume was above the selected reference. Hypothesis: the next four bars show a different return distribution than other events under the same definition.” This language is less theatrical than a prediction and easier to evaluate later.
Include one screenshot that preserves enough surrounding history to show the context. A crop containing only the successful candle removes much of the evidence a reviewer needs.
Conclusion: learn the data before the pattern
Read the interval, the four prices, the proportions, and the surrounding structure before interpreting a candlestick. Keep observations distinct from hypotheses, check the source and adjustments, and test rules with realistic timing. Candlestick charts are a useful language for describing price action. Their value improves when that language is precise enough to challenge, reproduce, and learn from.


