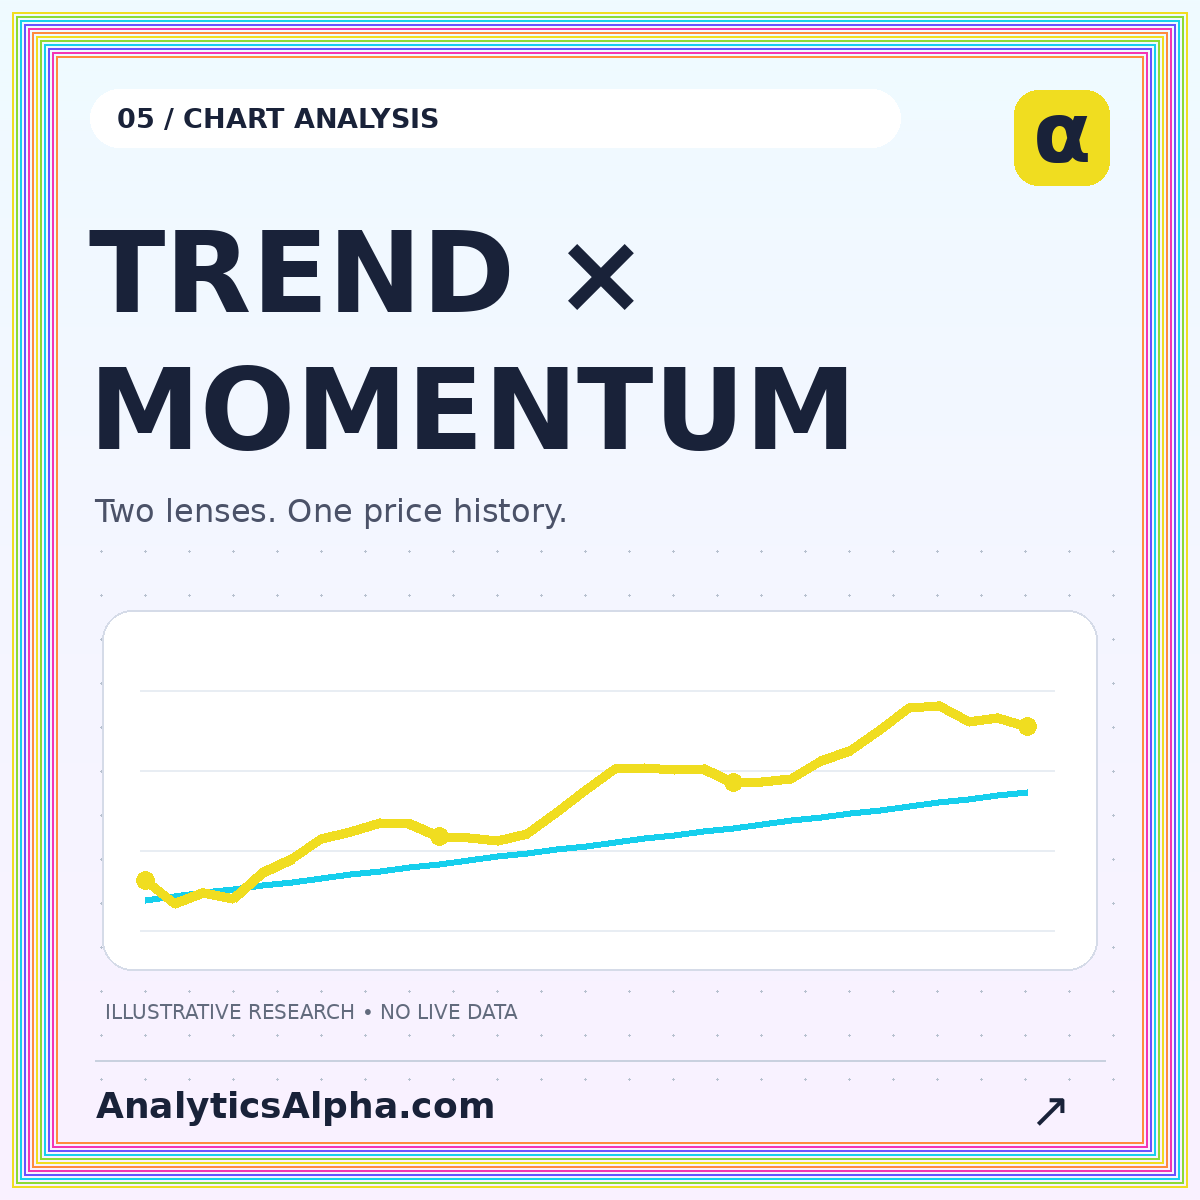
Moving averages and momentum indicators offer different summaries of the same price history. A moving average smooths selected observations to make their trend easier to inspect. A momentum measure describes change over a defined interval or the balance of recent gains and losses. Neither creates new price information, and adding both does not automatically create two independent confirmations.
A useful indicator workflow begins with a question, a formula, and a chosen observation frequency. This guide explains the tradeoffs using invented prices and reproducible comparisons. It does not prescribe an indicator setting or claim that a crossover can reliably predict the next move.
Understand the averaging window
A simple moving average is the arithmetic mean of the last specified number of observations. For five hypothetical closing prices of 100, 102, 101, 103, and 104, the five-period average is 102. When a new close of 105 arrives, the oldest value drops out and the new average becomes 103.
That rolling calculation creates a smooth line because each new observation is combined with several older ones. It also introduces lag. A line based on a longer window generally responds more slowly to a change in recent prices. A shorter window responds faster but follows more of the short-term fluctuation.
The unit is a period, not automatically a day. A twenty-period average on hourly bars and a twenty-period average on daily bars describe different histories. Label the chart interval and lookback together so that a setting can be reproduced.
Smoothing is a tradeoff, not an upgrade
Consider a price series that alternates between 99 and 101 before jumping to 110. A longer average will suppress much of the earlier alternating movement, but it will also take time to move toward the new level. The feature that makes it look calm is the same feature that delays its response.
An exponential moving average assigns a different weighting pattern, with more emphasis on recent observations under its specified smoothing parameter. This can make it respond differently from a simple average. It does not remove the need to choose a parameter or the possibility that the signal is reacting to temporary noise.
Rather than asking which average is universally best, ask what horizon your analysis needs to describe. A setting should have a role in the research design, not merely produce the prettiest historical chart.
Define momentum in plain language
A simple rate-of-change measure compares today's price with the price a specified number of periods earlier. If a hypothetical price increases from 100 to 108 over that interval, its percentage change is 8%. Changing the lookback changes the reference and therefore the reading.
Other momentum measures summarize gains and losses differently. The relative strength index, or RSI, scales a particular comparison of smoothed upward and downward price changes to a range from zero to one hundred. It is not the same thing as comparing one security's return with another security's return, despite the potentially confusing name.
Fidelity's RSI guide explains the indicator and notes that traditionally high or low readings can persist during strong trends. Treat threshold labels as conventions describing the calculation, not commands to buy or sell.
Read trend and momentum separately
A price series can remain above a rising moving average while its rate of change slows. That combination is not necessarily contradictory. The average describes a smoothed level; the momentum reading describes movement relative to another observation or a particular balance of recent changes.
Imagine closes of 100, 106, 110, 112, and 113. Price is still rising, but each step is smaller. A momentum measure can weaken while a trend measure remains positive. That observation does not determine whether price will reverse, pause, or accelerate again.
Write both statements before adding an interpretation. “Price is above the chosen average” and “the selected momentum reading is below its prior value” are clearer than saying the market is “definitely exhausted.” The first pair can be checked against data; the latter adds a prediction.
Crossovers need execution rules
A crossover occurs when the relative position of two plotted series changes under a defined rule. If the rule uses completed closing prices, its confirmation time is the close of that bar. A backtest should not assume a favorable earlier entry within the same bar unless the necessary information and executable order were actually available.
Specify whether equality counts, whether one or several completed bars are required, and what happens when the series cross repeatedly. Add an exit rule and cost model. Without those details, a chart of crossover markers is an illustration, not a trading-system result.
Sideways sequences can generate repeated changes in the relationship. Instead of erasing those observations, retain them and quantify their effect on turnover, execution costs, and outcome distribution.
Avoid double-counting evidence
Many indicators transform overlapping inputs. A moving-average crossover and an indicator derived from moving-average differences may respond to closely related features of the same price series. Presenting them as independent votes can exaggerate the amount of distinct information available.
Ask what each additional view contributes. Does volume introduce a separately measured aspect of activity? Does a volatility estimate help describe the size of recent movement? Does a higher-frequency chart merely repeat the same observation in another format? More panels are not necessarily more insight.
The technical indicators guide groups views by the question they answer. Start with a small set whose definitions you can explain, and add another only when the existing views leave a specific question unresolved.
Test the settings without chasing the answer
Choosing a parameter after trying dozens of alternatives on the same history creates an important interpretation problem: the selected setting benefited from seeing that history. A superior result within that sample may not carry into observations that were not used to choose it.
A practical research record should retain the alternatives tested, their selection criterion, and a later evaluation period. Prefer a clear rationale over an elaborate grid of numbers that has no economic or operational explanation. Examine nearby settings to see whether the result depends on one narrow choice.
The stock trading system research page describes how to preserve these decisions. A locked evaluation period helps protect against moving the goalposts, although it does not guarantee that a strategy will work in deployment.
Check warm-up and missing data
An indicator needs enough prior observations to calculate its intended value. At the start of a dataset, a charting platform may omit the value, use a shorter window, or apply an initialization convention. Those choices can matter when comparing one implementation with another.
Missing bars also require attention. Filling an unavailable price with the previous close changes the implied sequence of returns. Treating a closed market as a zero-volume trading interval can change a reference average. Document what the data actually represent instead of assuming the visual continuity of a chart guarantees completeness.
When comparing results, save the data version, bar frequency, input field, parameter, and initialization method. A screenshot is useful context, but it cannot capture all of those settings reliably.
A simple study exercise
Create a short invented price sequence with three phases: an alternating range, a sustained rise, and a sharp decline. Calculate two moving averages and one rate-of-change series. Before viewing the results, write how you expect each measure to respond in each phase.
Then compare the readings with the raw prices. Identify where smoothing helped describe the sequence, where it lagged, and where different measures appeared to disagree for understandable reasons. Repeat with a nearby lookback without selecting a “winning” version. This exercise builds familiarity with the tools without confusing an educational illustration with evidence of a trading edge.
Conclusion: indicators are defined lenses
Moving averages summarize levels; momentum indicators summarize selected changes. Read their formulas, intervals, and limitations before interpreting their shapes. Keep execution timing explicit, avoid counting correlated transformations as independent proof, and preserve the settings used in research. The goal is not a more crowded chart, but a more precise understanding of what each panel can and cannot tell you.


