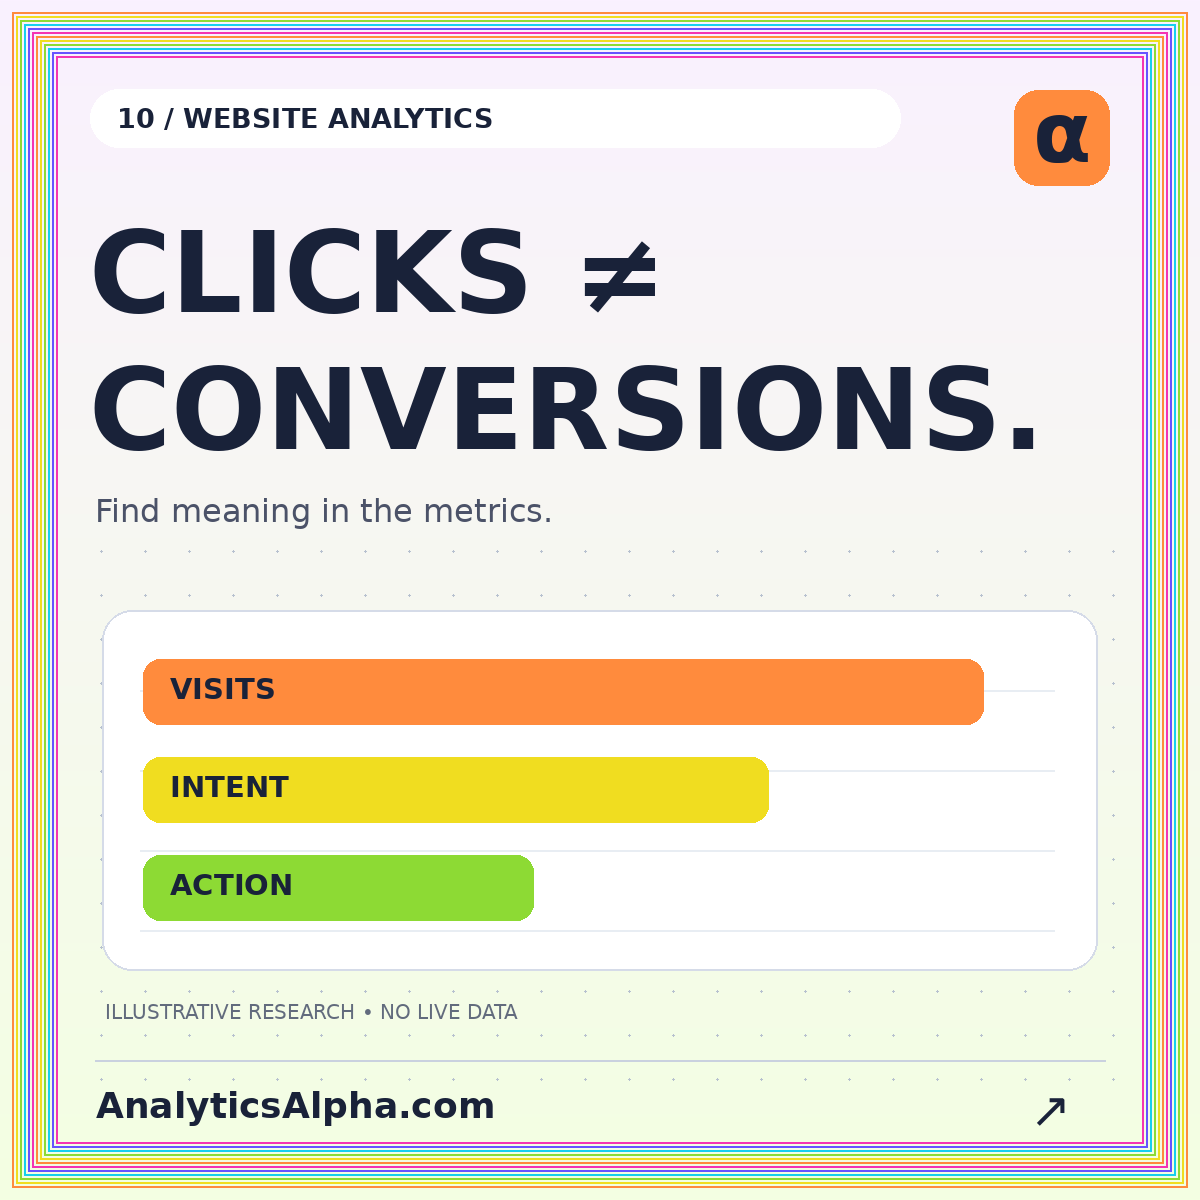
Website analytics becomes useful when a metric is connected to a decision. A rise in visits can be encouraging, but it does not automatically mean more qualified interest, completed actions, or revenue. A falling conversion rate can also be misleading if the mix of visitors changed. Start with the behavior you need to understand before choosing the dashboard.
On AnalyticsAlpha, “website analytics alpha” describes a clearer understanding of website performance. It is a brand theme, not the same financial measure as portfolio alpha. This guide uses hypothetical website data to show how to move from traffic counts to a defensible measurement plan.
Define the outcome in observable terms
Choose an event that corresponds to a meaningful completed action. Depending on the site, that might be a confirmed purchase, a completed inquiry, a downloaded resource, or another explicitly defined interaction. The label should describe what was actually observed, not an inferred intention.
A button click and a successful form submission are different events. A click can occur even when the destination fails. Similarly, reaching a checkout page does not prove that an order completed. Define where the event is triggered and how it is checked against the underlying process.
For an editorial site, meaningful engagement may not be a purchase at all. A reading or navigation event can answer a useful question when its definition is transparent. Avoid turning every interaction into a “conversion” simply to increase the count.
Choose the denominator before calculating a rate
A rate requires a numerator and a denominator that describe a coherent population. Session conversion rate, user conversion rate, and event frequency are different quantities. Dividing a count of repeated events by unique people may produce a number that should not be interpreted as the percentage of people who converted.
Imagine 1,000 hypothetical sessions, of which 40 include a completed inquiry. The session conversion rate is 4%. If those 40 sessions produce 55 inquiry events because some sessions contain more than one, dividing 55 by 1,000 gives an event-per-session rate of 5.5%, not the same measure.
Google Analytics documentation on key-event counting explains the distinction between counting once per event and once per session. Platform settings matter. Record the selected method and its effective date so that a change in configuration is not mistaken for a change in behavior.
Build a small measurement dictionary
For each metric, write its name, plain-language meaning, event definition, denominator, exclusions, and reporting interval. Add the business question it supports and the action a change might prompt. This makes the dashboard a working reference rather than a wall of numbers.
For example, “qualified inquiry session rate” might count sessions with a verified inquiry outcome, divided by eligible sessions, excluding internal tests under a documented rule. “Landing-page click rate” might count sessions with a specific navigation click. The two should not be compared as though they measure the same level of commitment.
The website analytics guide separates acquisition, engagement, and conversion. A clear dictionary helps prevent a discussion about one stage from being answered with a metric from another.
Inspect acquisition before judging the average
Traffic sources can bring visitors with different purposes. A broad informational article and a detailed product comparison may attract different stages of interest. A blended website average can shift simply because one group became a larger share of the total.
Consider two hypothetical channels. Channel A brings 100 sessions with ten completed actions, while Channel B brings 900 sessions with eighteen. The overall rate is 2.8%, even though the channel rates are 10% and 2%. If Channel B doubles while both channel rates stay unchanged, the site's blended rate declines. The lower average does not prove that either channel became less effective.
Show both the group counts and rates before proposing a fix. A composition change is different from a within-group performance change, and it calls for a different question.
Read a funnel as a defined sequence
A funnel describes progression through specified stages, such as landing, product detail, checkout, and confirmed order. State whether users must complete the stages in order and within what time window. A closed funnel requiring the first stage differs from an open funnel that allows entry at later stages.
For an invented sequence of 1,000 landings, 400 product views, 120 checkout starts, and 36 confirmed orders, the final count is 3.6% of the first stage. The checkout-to-order rate is 30%. Both are correct under the example, but they describe different parts of the journey.
A drop between stages is not automatically a design defect. Visitors may be comparing, researching, or leaving for reasons the event data do not explain. Use the funnel to identify where to investigate, not to invent a psychological explanation.
Check instrumentation before changing the site
A measurement error can look like a business problem. An event may fire twice, stop firing on one page template, or trigger before an action is confirmed. A changed URL or navigation path can also affect how traffic is classified.
Create a small test plan covering the main journeys on mobile and desktop. Verify event names, parameters, successful outcomes, and repeated actions. Preserve a log of analytics configuration changes, releases, and known outages alongside the reporting timeline.
Where possible, reconcile completed business events with a separate operational record using the same definitions and interval. Differences are a prompt to investigate, not necessarily evidence that one system is wrong. Each may count a different population or moment in the process.
Treat attribution as a model
Attribution assigns credit among observed interactions according to a selected method. That assignment can help organize reporting, but it does not by itself establish the incremental effect of a marketing activity. A channel receiving credit is not proof that the outcome would disappear without that channel.
State the lookback window, identity assumptions, and attribution model when those settings affect the report. Cross-device behavior, unobserved visits, consent choices, and missing data can limit the completeness of the recorded path. Avoid presenting a neat percentage split as a complete account of causation.
A controlled experiment can sometimes address a narrower causal question, but it requires its own design and assumptions. Keep an observational attribution report and an experimental result clearly separated.
Use experiments for a specific question
Before testing a page change, define the eligible population, assignment method, primary outcome, and evaluation period. Avoid repeatedly checking the results and stopping whenever one version appears favorable unless the analysis method explicitly supports that procedure.
Choose an outcome close enough to the purpose of the change to be meaningful. A larger click count is not necessarily an improvement if the clicks lead to confusion or fewer completed actions. Include guardrail measures that capture plausible unintended effects, such as errors in the journey.
Small samples may leave substantial uncertainty. Report the observed counts and the limits of the comparison rather than declaring a winner from a slight difference. An inconclusive test can still clarify what additional evidence is needed.
Respect data minimization
Collect only information needed for the stated measurement purpose. Avoid placing passwords, payment details, sensitive free text, or unnecessary personal identifiers into analytics events or URLs. Coordinate the measurement design with the site's privacy disclosures and the requirements that apply to its actual deployment.
This static AnalyticsAlpha site does not install a tracking platform or accept analytics credentials. Its examples are illustrative. The methodology page explains the scope of the displayed sample data so that educational dashboards are not confused with a connected reporting service.
Conclusion: connect metrics to decisions
Start with a defined outcome, choose a coherent denominator, and inspect the groups behind the average. Validate instrumentation, distinguish attribution from causation, and design tests around specific questions. Website analytics is most useful when a reader can trace every number back to a definition and understand what decision it can reasonably support.


